The Next Many
2025IKEA designs for "the many people", but who are the many becoming? In the West the nuclear family is in decline; across the rest of the world, culturally specific household types go unseen when a Western brand exports 'cookie-cutter' concepts. The Next Many is a human-led, story-driven, data-backed global study of household shifts through to 2030, to identify expansion pathways with regionalization, personalization and service innovation in mind.
- Partner
- IKEA
- Role
- Data-driven research lead
- With
- A commissioned group of data analysts
- Type
- Design research
- Markets
- 🇺🇸 USA · 🇨🇳 China · 🇳🇱 Netherlands · 🇮🇳 India
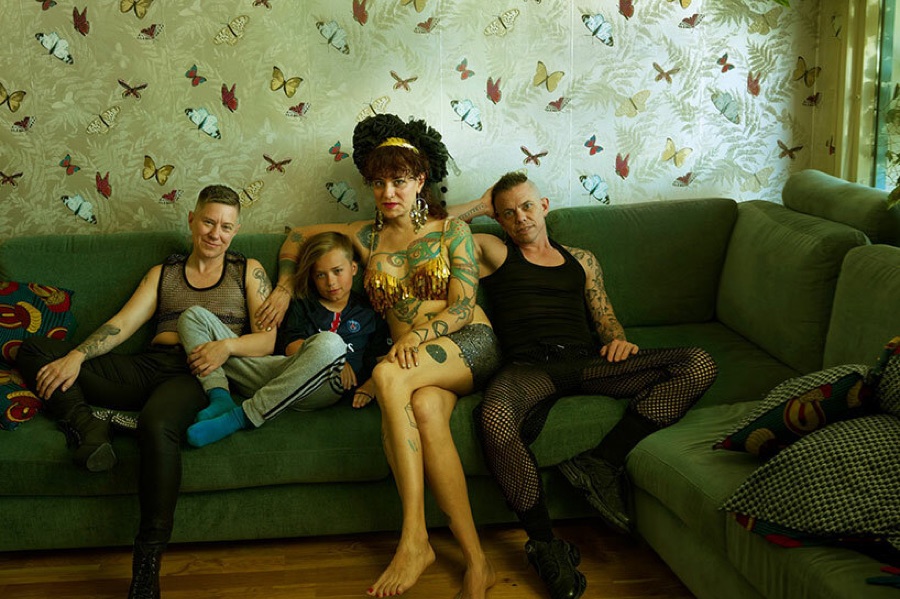
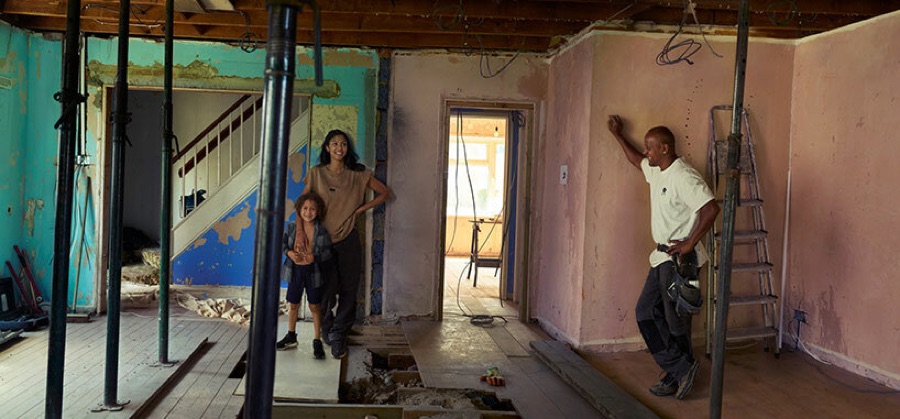
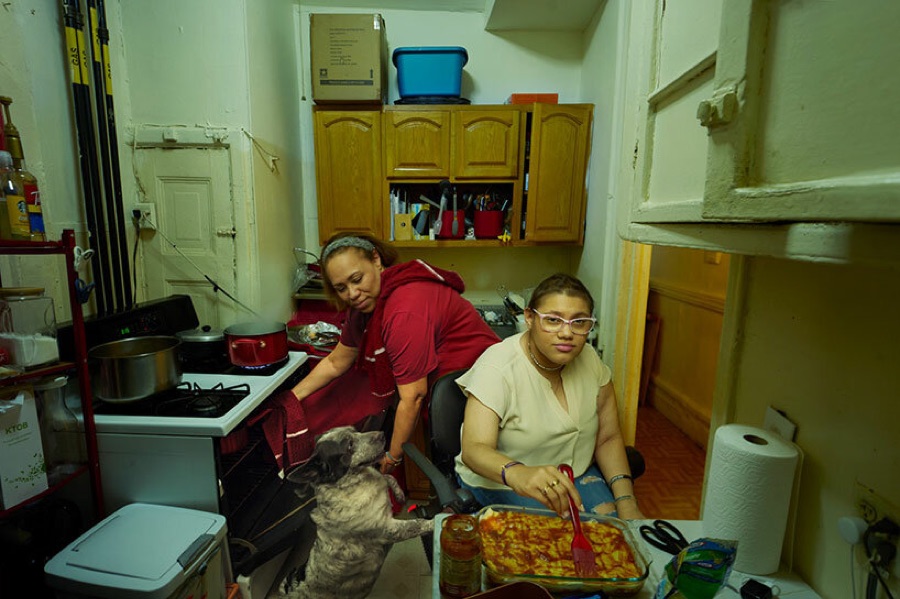
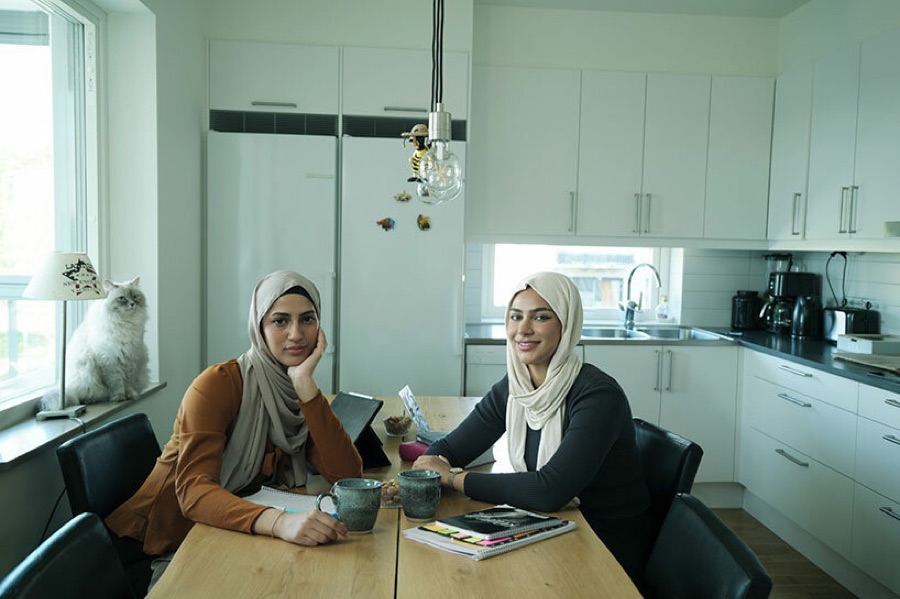
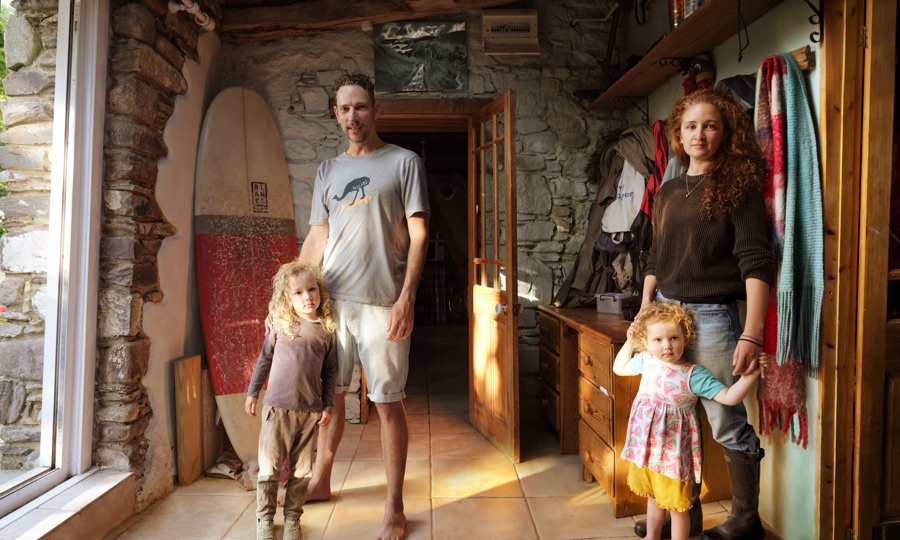
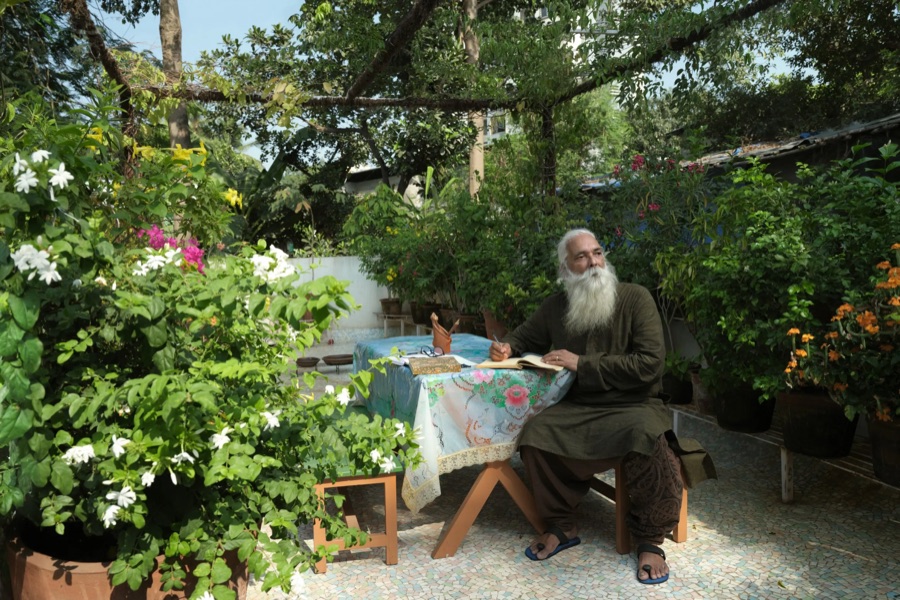

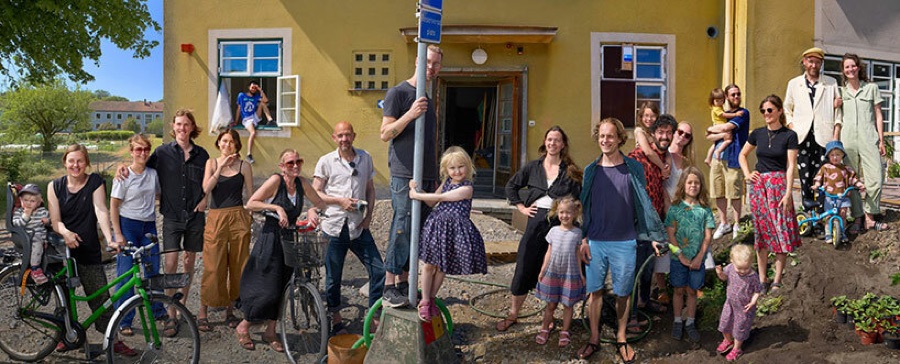

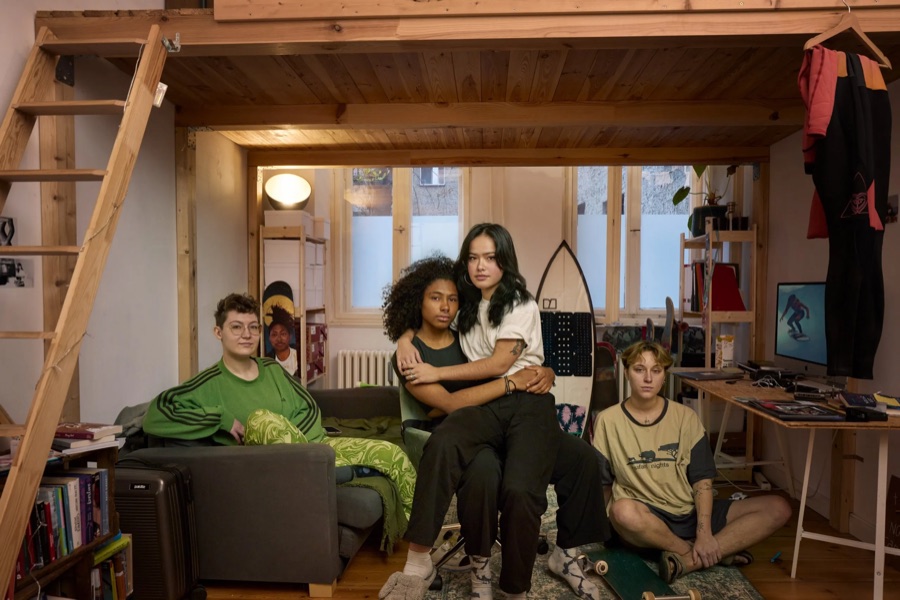
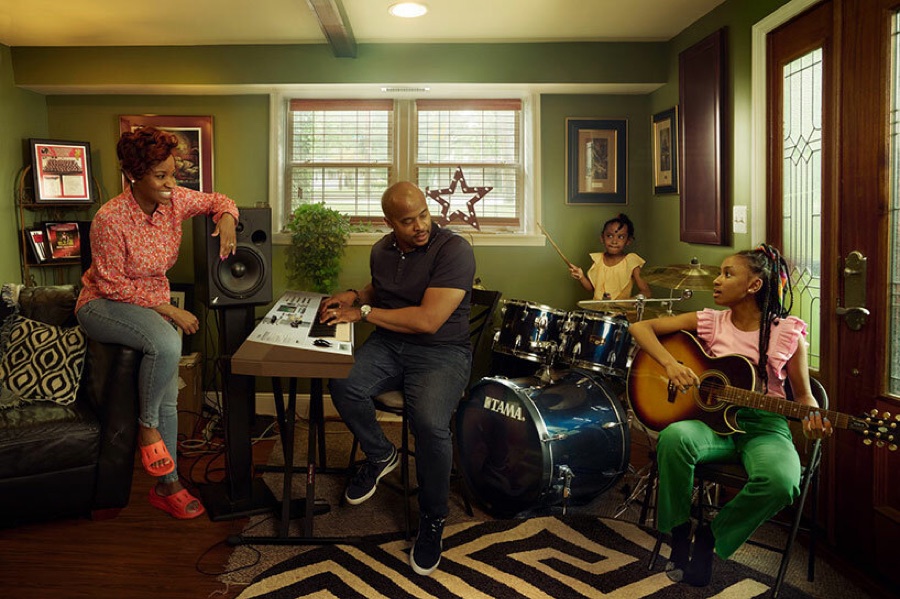
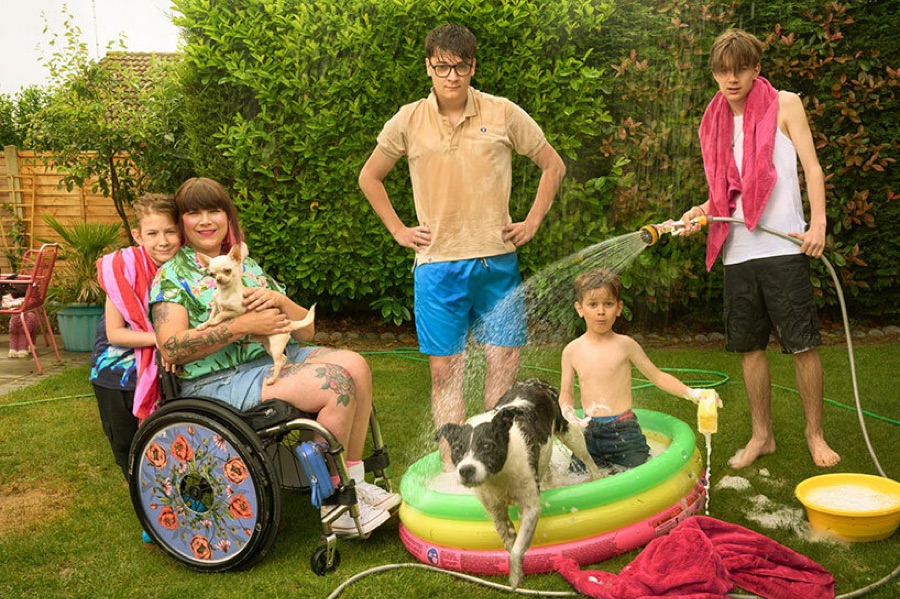
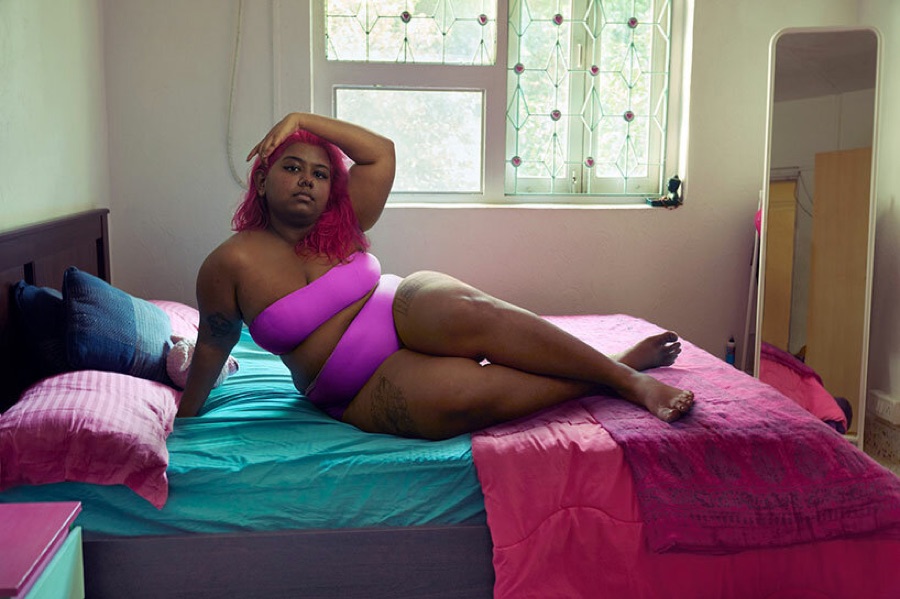
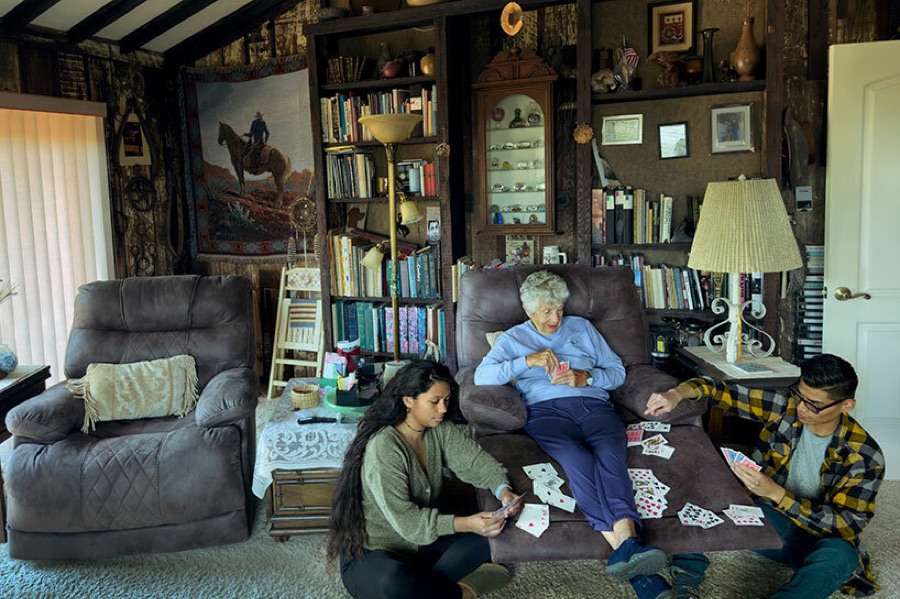
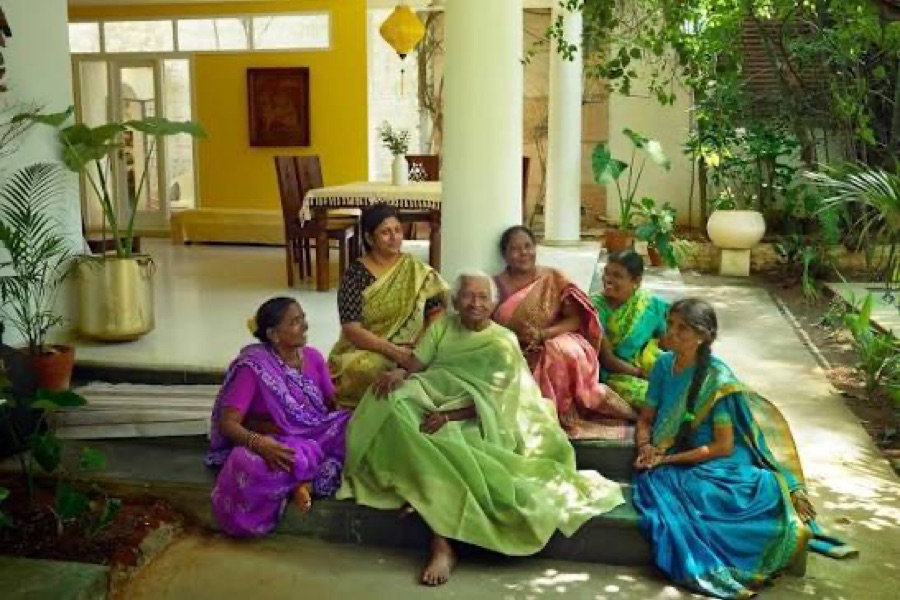


The many, in one frame. Households around the world, from living alone to multi-generational and chosen families. Photographed by Annie Leibovitz, commissioned by IKEA Group Communications. Hover to pause.
Outcome in numbers
The company's existing "one-size-fits-all view" has been challenged for years, losing market share among younger generations and non-nuclear families, and risking future expansion efforts, brand relevance and customer acquisition.
The households IKEA serves are diversifying faster than the brand delivers personalized experiences and services. The household types that matter in China or India, for instance, are not the ones a Western brand assumes when it exports its concept, services and stores. To better inform decisions on customer-related topics, I led a working group to explore and define the customer segments relevant in four core Ingka markets, focusing on the household and how it is changing while recognizing its cultural uniqueness.
Data-driven design research across four countries, mapping households through the lens of the circle of life rather than the family tree: which household types people move through at each life stage, which are emerging, growing or declining, and which are routinely forgotten, from asylum-seeker families to skipped-generation households. I commissioned and directed a group of design researchers, data analysts and a visual designer to deliver an interactive dashboard, so the information holds up to use, and supported the program by delivering the human stories in the form of exhibitions.
The many families
Every household is a home. Click one to discover who lives there ↓
Expected change, 2010 → 2030
The many families. The household typology from the interactive dashboard, rebuilt for the web. Click a household to explore who lives there; toggle the growth view to see who the many are becoming by 2030.
ⓘ About the data
Contextual attributes. Applicable to any household: gender, cultural background, sexual orientation, family ties (adopted, fostered, biological, chosen), disability, living arrangement, religious affiliation, values, lifestyle.
Kept confidential. The specific data behind these shifts is IKEA internal. Shown here is the structure of the typology, with directional trends from public sources.
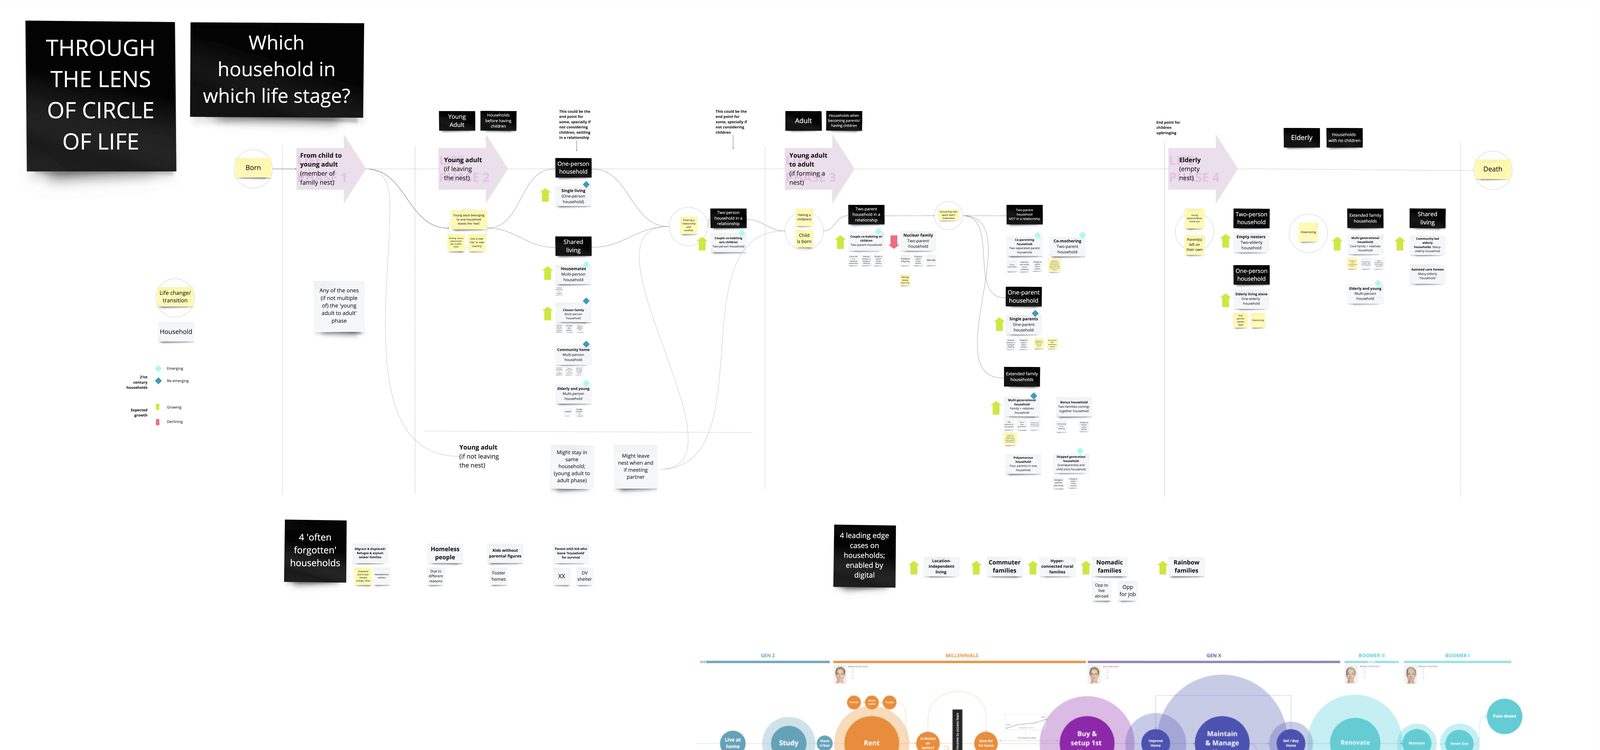
Through the lens of the circle of life. The home journey is not linear, it cycles. Every household type mapped along life's transitions, from leaving the nest to shared living in older age, with emerging, growing and declining types flagged at each stage.
One interactive dashboard for internal teams. Built for the teams innovating around business expansion and new business, it grew into a company-wide reference used by research, design, data analytics, strategy and market penetration teams, scaling from 350 to 1,250 colleagues.
A typology of household types per country, hosted in that dashboard so teams can explore who the many are becoming market by market; the version above is rebuilt from it.
The research also grounded the "In Search for the Many" exhibition and the initial setup for the Better Living Platform project, which turned the data into real stories and service concepts.