Environmental Footprint Insights
2021Most of us can't picture our own carbon footprint, so it stays abstract and easy to ignore. How might PwC give every employee a clear, personal view of the emissions behind their travel and commuting, and make the greener choice the obvious one?
- Partner
- PwC
- Role
- Experience Strategist (Individual contributor)
- Type
- New product development
- Markets
- 🇳🇱 Netherlands · 🇫🇷 France · 🇸🇪 Sweden · 🇹🇷 Turkey
- Recognition
- Dutch Creativity Awards
- More
- PwC write-up ↗
The campaign. The film that introduced Environmental Footprint Insights across PwC, making the case for a personal view of mobility emissions.
Outcome in numbers
PwC Netherlands had set a net-zero ambition for 2030, and the pandemic had just shown how far mobility emissions can fall when travel stops. The task was to make that company-level target personal: give each employee insight into the CO2 behind their own business travel and commuting, so the reductions seen during lockdown could carry into the new normal.
VisionA platform that lets project leaders and employees plan and run projects more sustainably, by forecasting and tracking the carbon footprint that comes directly from project mobility.
The core pivot was behavioral. Partners and directors are the gatekeepers of how a project is staffed and run, so the tool had to influence them, not only individual employees. We reframed carbon as a budget line owned at the top: forecast it, track it, and report on it alongside cost and time.
Hypothesis: will embedding the cost of carbon into project planning and reporting influence partners and directors to run their projects and teams more sustainably?
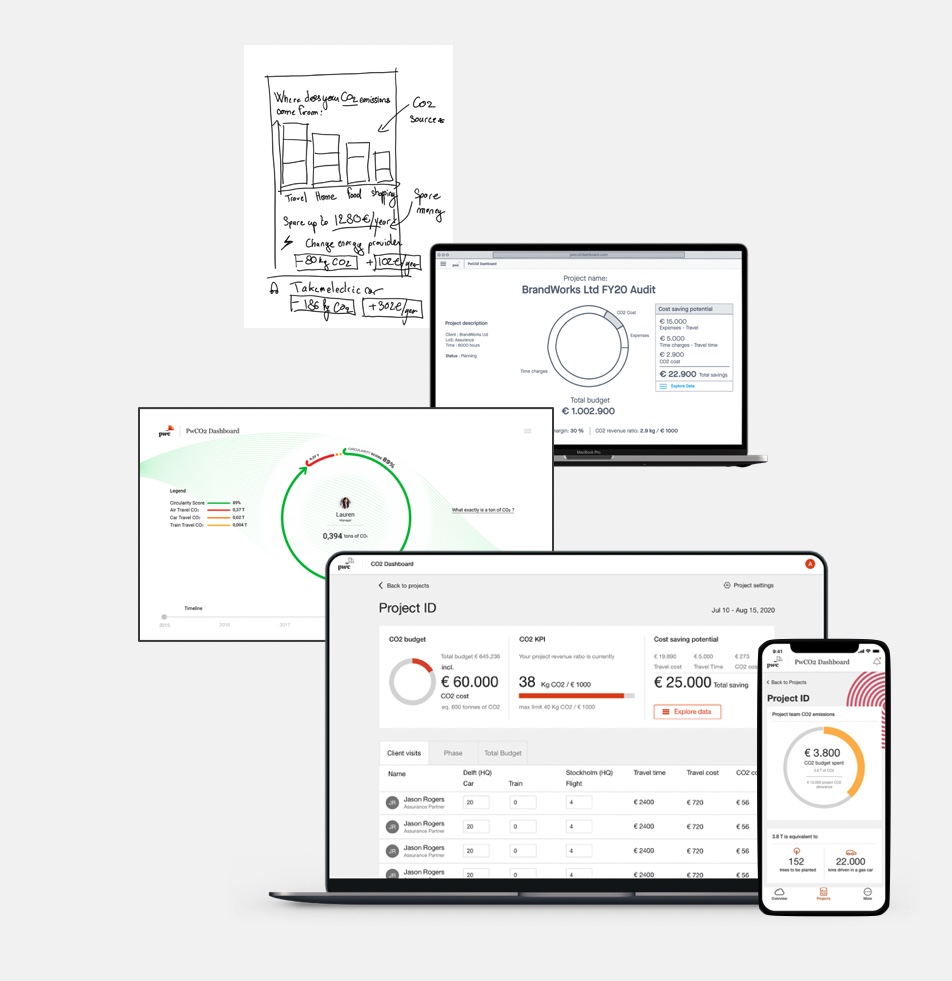
The process. From a first sketch of "where do your emissions come from?" to a working project and personal CO2 dashboard, the evolution from concept to product.
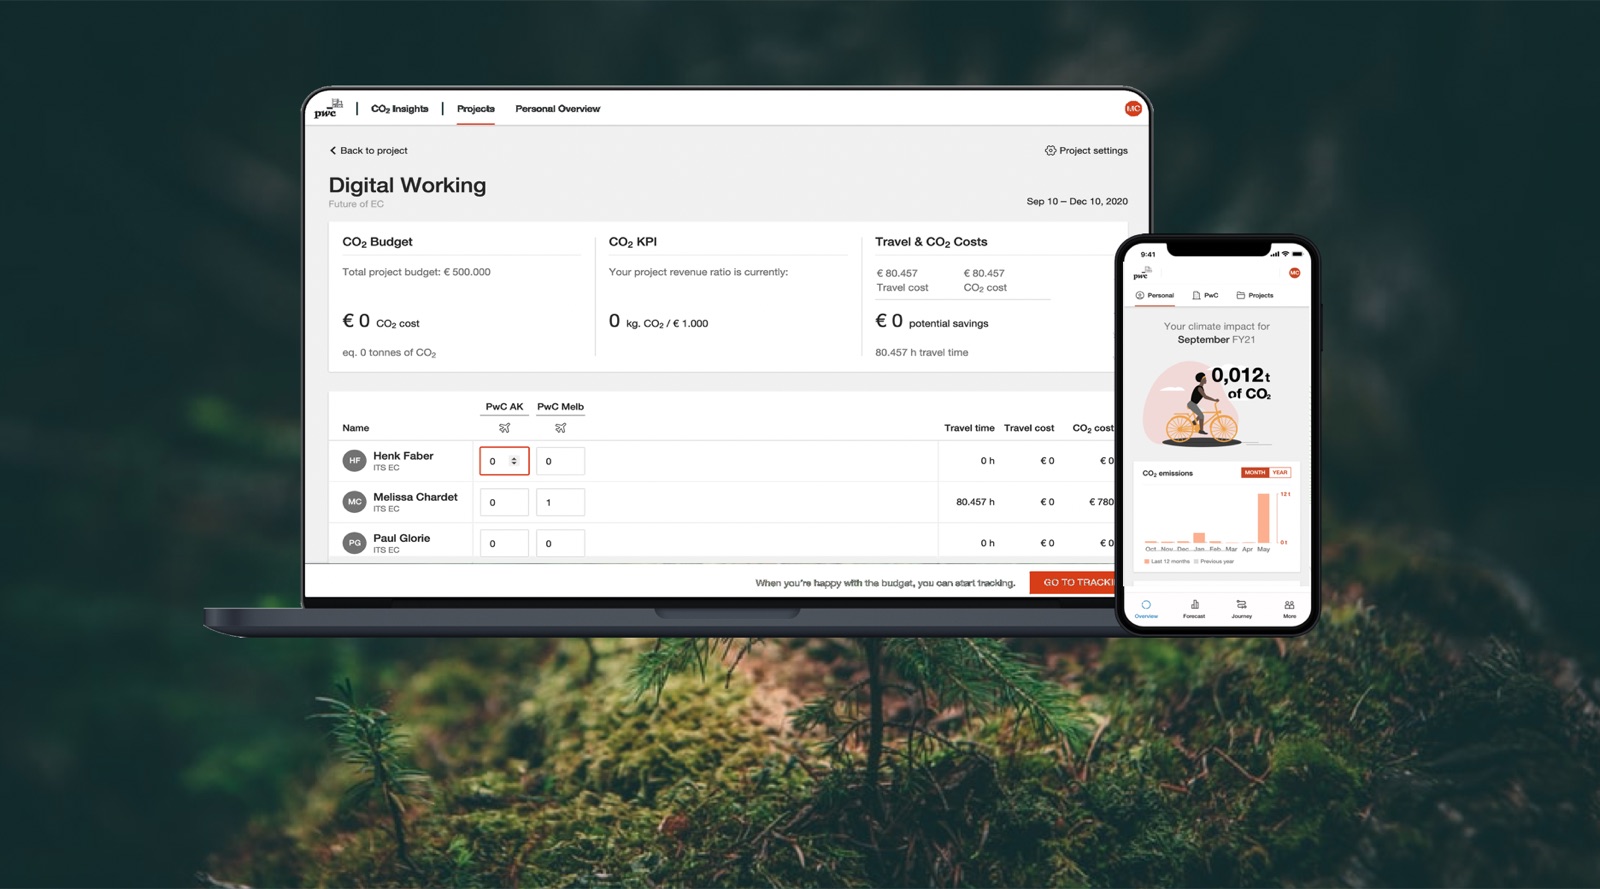
The tool. Project leaders set a CO2 budget and track it alongside cost and time; each employee sees their personal climate impact in relatable terms.
0 → 1 product development through a design-led innovation process. I worked in a team of product managers, engineers, UX designers and creatives to research and build a sustainable-mobility tracking tool, accessible to thousands of PwC employees, that helps them make greener commuting choices and reduce fuel dependency. I contributed to the problem-space definition and the creative design.
A closer look. How the tool translates carbon into relatable terms, like the number of trees needed to offset your car kilometers.
Environmental Footprint Insights rolled out across PwC Netherlands, giving employees a personal dashboard that translates their mobility emissions into relatable terms, such as the number of trees needed to offset their car kilometers. It supports PwC's net-zero-by-2030 ambition, was recognized at the Dutch Creativity Awards, and was covered in the Dutch press.